What CFOs Actually Look At
Not all metrics are created equal in the CFO's eyes.
Metrics That Don't Move CFOs
- Cost Avoidance: "We prevented €500K in price increases." How? Prove it. Where does it show up?
- Savings Percentage: "We saved 12% on this category." Compared to what baseline? Is it cash or theoretical?
- Supplier Count: "We reduced suppliers from 200 to 150." Interesting. Did costs go down? Did quality improve?
Metrics That Get Attention
- Cash Collected: "€240K in rebates deposited this quarter." That's real. That's bankable.
- Forecast Accuracy: "Rebate income was €15K above forecast." That builds trust in projections.
- Capture Rate: "We claimed 94% of available incentives." That shows execution quality.
According to Gartner research, leading procurement organizations have shifted from "savings" metrics to "value capture" metrics - measuring what's actually collected, not what's theoretically negotiated.
The CFO doesn't want stories. The CFO wants numbers that hit the P&L.
The Cost Avoidance Problem
Cost avoidance is procurement's most problematic metric.
The Definition Problem: Cost avoidance means different things to different people.
- Supplier proposed 5% increase, you negotiated to 3% = "2% avoided"
- You switched suppliers at a lower price = "X% avoided vs. old supplier"
- Market prices rose, your prices stayed flat = "market avoidance"
Each definition is reasonable. None produces a verifiable number.
The Visibility Problem: Cost avoidance doesn't appear on any financial statement.
- No line item says "Costs We Didn't Pay"
- No audit trail to verify the baseline
- No cash flow impact to measure
The Credibility Problem: After years of claiming large avoidance numbers, CFOs are skeptical.
"If we've avoided €5M in costs over the past three years, why haven't margins improved?"
Cost avoidance isn't useless - but it's not a primary metric. It's supporting context at best.
The CFO Metrics Framework
Here's what CFOs actually want to see from procurement:
1. Rebate/Incentive Income
- Total rebates claimed this period
- Rebates as percentage of qualifying spend
- Comparison to prior period
- Forecast for next period
2. Capture Rate
- Available incentives vs. claimed incentives
- Trend over time (improving, declining, stable)
- By supplier, category, mechanism type
3. Working Capital Impact
- Early payment discounts captured
- Payment term optimization results
- Cash timing improvements
4. Variance Analysis
- Actual vs. forecast (with explanation)
- Actual vs. prior year (with drivers)
- Risk/opportunity for remainder of period
According to McKinsey research, high-performing organizations measure "value realization" - what's actually captured - rather than "value negotiated."
If it doesn't convert to cash or show up in financials, it's not a CFO metric.
Why Activity Metrics Persist
Why do procurement teams report activity metrics instead of outcome metrics?
Negotiation Is Visible, Execution Is Not
Everyone sees the negotiation. Contracts get signed with fanfare.
Execution happens quietly. Rebates get claimed (or not) without ceremony.
Metrics follow visibility.
Activity Is Controllable, Outcomes Depend on Systems
Procurement controls negotiations. They can report what they negotiated.
Outcomes depend on tracking systems, AP processes, cross-functional coordination.
Without good systems, outcome metrics are hard to produce.
Historical Precedent
Procurement has always reported savings. Changing metrics means changing the conversation.
That requires confidence that the new metrics will look good.
According to World Commerce & Contracting, 9% of contract value leaks through poor management. Much of that leakage is invisible in activity metrics - only outcome metrics reveal it.
How the Conversation Changes
Before (Activity Metrics):
"This quarter, procurement achieved €1.2M in savings through negotiations across 47 contracts. We consolidated 12 suppliers and reduced contract cycle time by 15%."
CFO Reaction: "Nice. Is any of that hitting the P&L? What's the cash impact?"
After (Outcome Metrics):
"This quarter, we collected €180K in supplier rebates - €12K above forecast. Capture rate improved from 71% to 78%. €45K in early payment discounts were taken, compared to €32K last quarter. Total verified cash impact: €237K."
CFO Reaction: "Good. What's the forecast for next quarter? Where can we improve capture rate further?"
The difference:
- Specific numbers tied to cash
- Comparison to forecast (accountability)
- Trend data showing improvement
- Clear path to further value
Activity reports describe what procurement did. Outcome reports show what procurement delivered.
Making the Transition
The Transition Framework:
Phase 1: Establish Baseline (Month 1-2)
- Identify all incentive mechanisms across supplier contracts
- Calculate total available value
- Determine current capture rate (claimed vs. available)
- Set baseline for improvement
Phase 2: Build Tracking (Month 2-3)
- Implement systematic threshold monitoring
- Create claim calendar with deadlines
- Establish documentation processes
- Connect to financial reporting
Phase 3: Report Outcomes (Month 3+)
- Report cash collected, not savings negotiated
- Show capture rate improvement
- Provide forecast accuracy analysis
- Identify remaining opportunity
Aberdeen Group research shows that best-in-class companies focus on "value realization" metrics - with 56% better contract performance than peers still using traditional savings metrics.
The Business Case: Outcome vs. Activity
Scenario: €30M annual supplier spend, typical incentive structures
Traditional Metrics (Activity Focus):
- Report: "€1.8M in negotiated savings"
- Actual capture rate: 65%
- Cash collected: Unknown (not tracked)
- CFO confidence: Low
Outcome Metrics (Cash Focus):
- Available incentives: €1.1M
- Cash collected: €715K (65% capture)
- Improvement opportunity: €385K
- Plan to reach 85%: Defined
The Math:
Moving from 65% to 85% capture rate = €220K additional cash annually.
That's real money. That's what CFOs want to see.
Outcome metrics don't just report better. They drive better results - because you manage what you measure.
Your Procurement Report: Activity or Outcome?
Look at your last procurement report to the CFO.
How many metrics were about money collected vs. money "saved"?
If it's mostly savings, you're speaking the wrong language.
The shift requires:
- Knowing what you're entitled to (available incentives)
- Tracking what you've captured (claimed incentives)
- Reporting the cash impact (collected value)
- Forecasting future capture (pipeline)
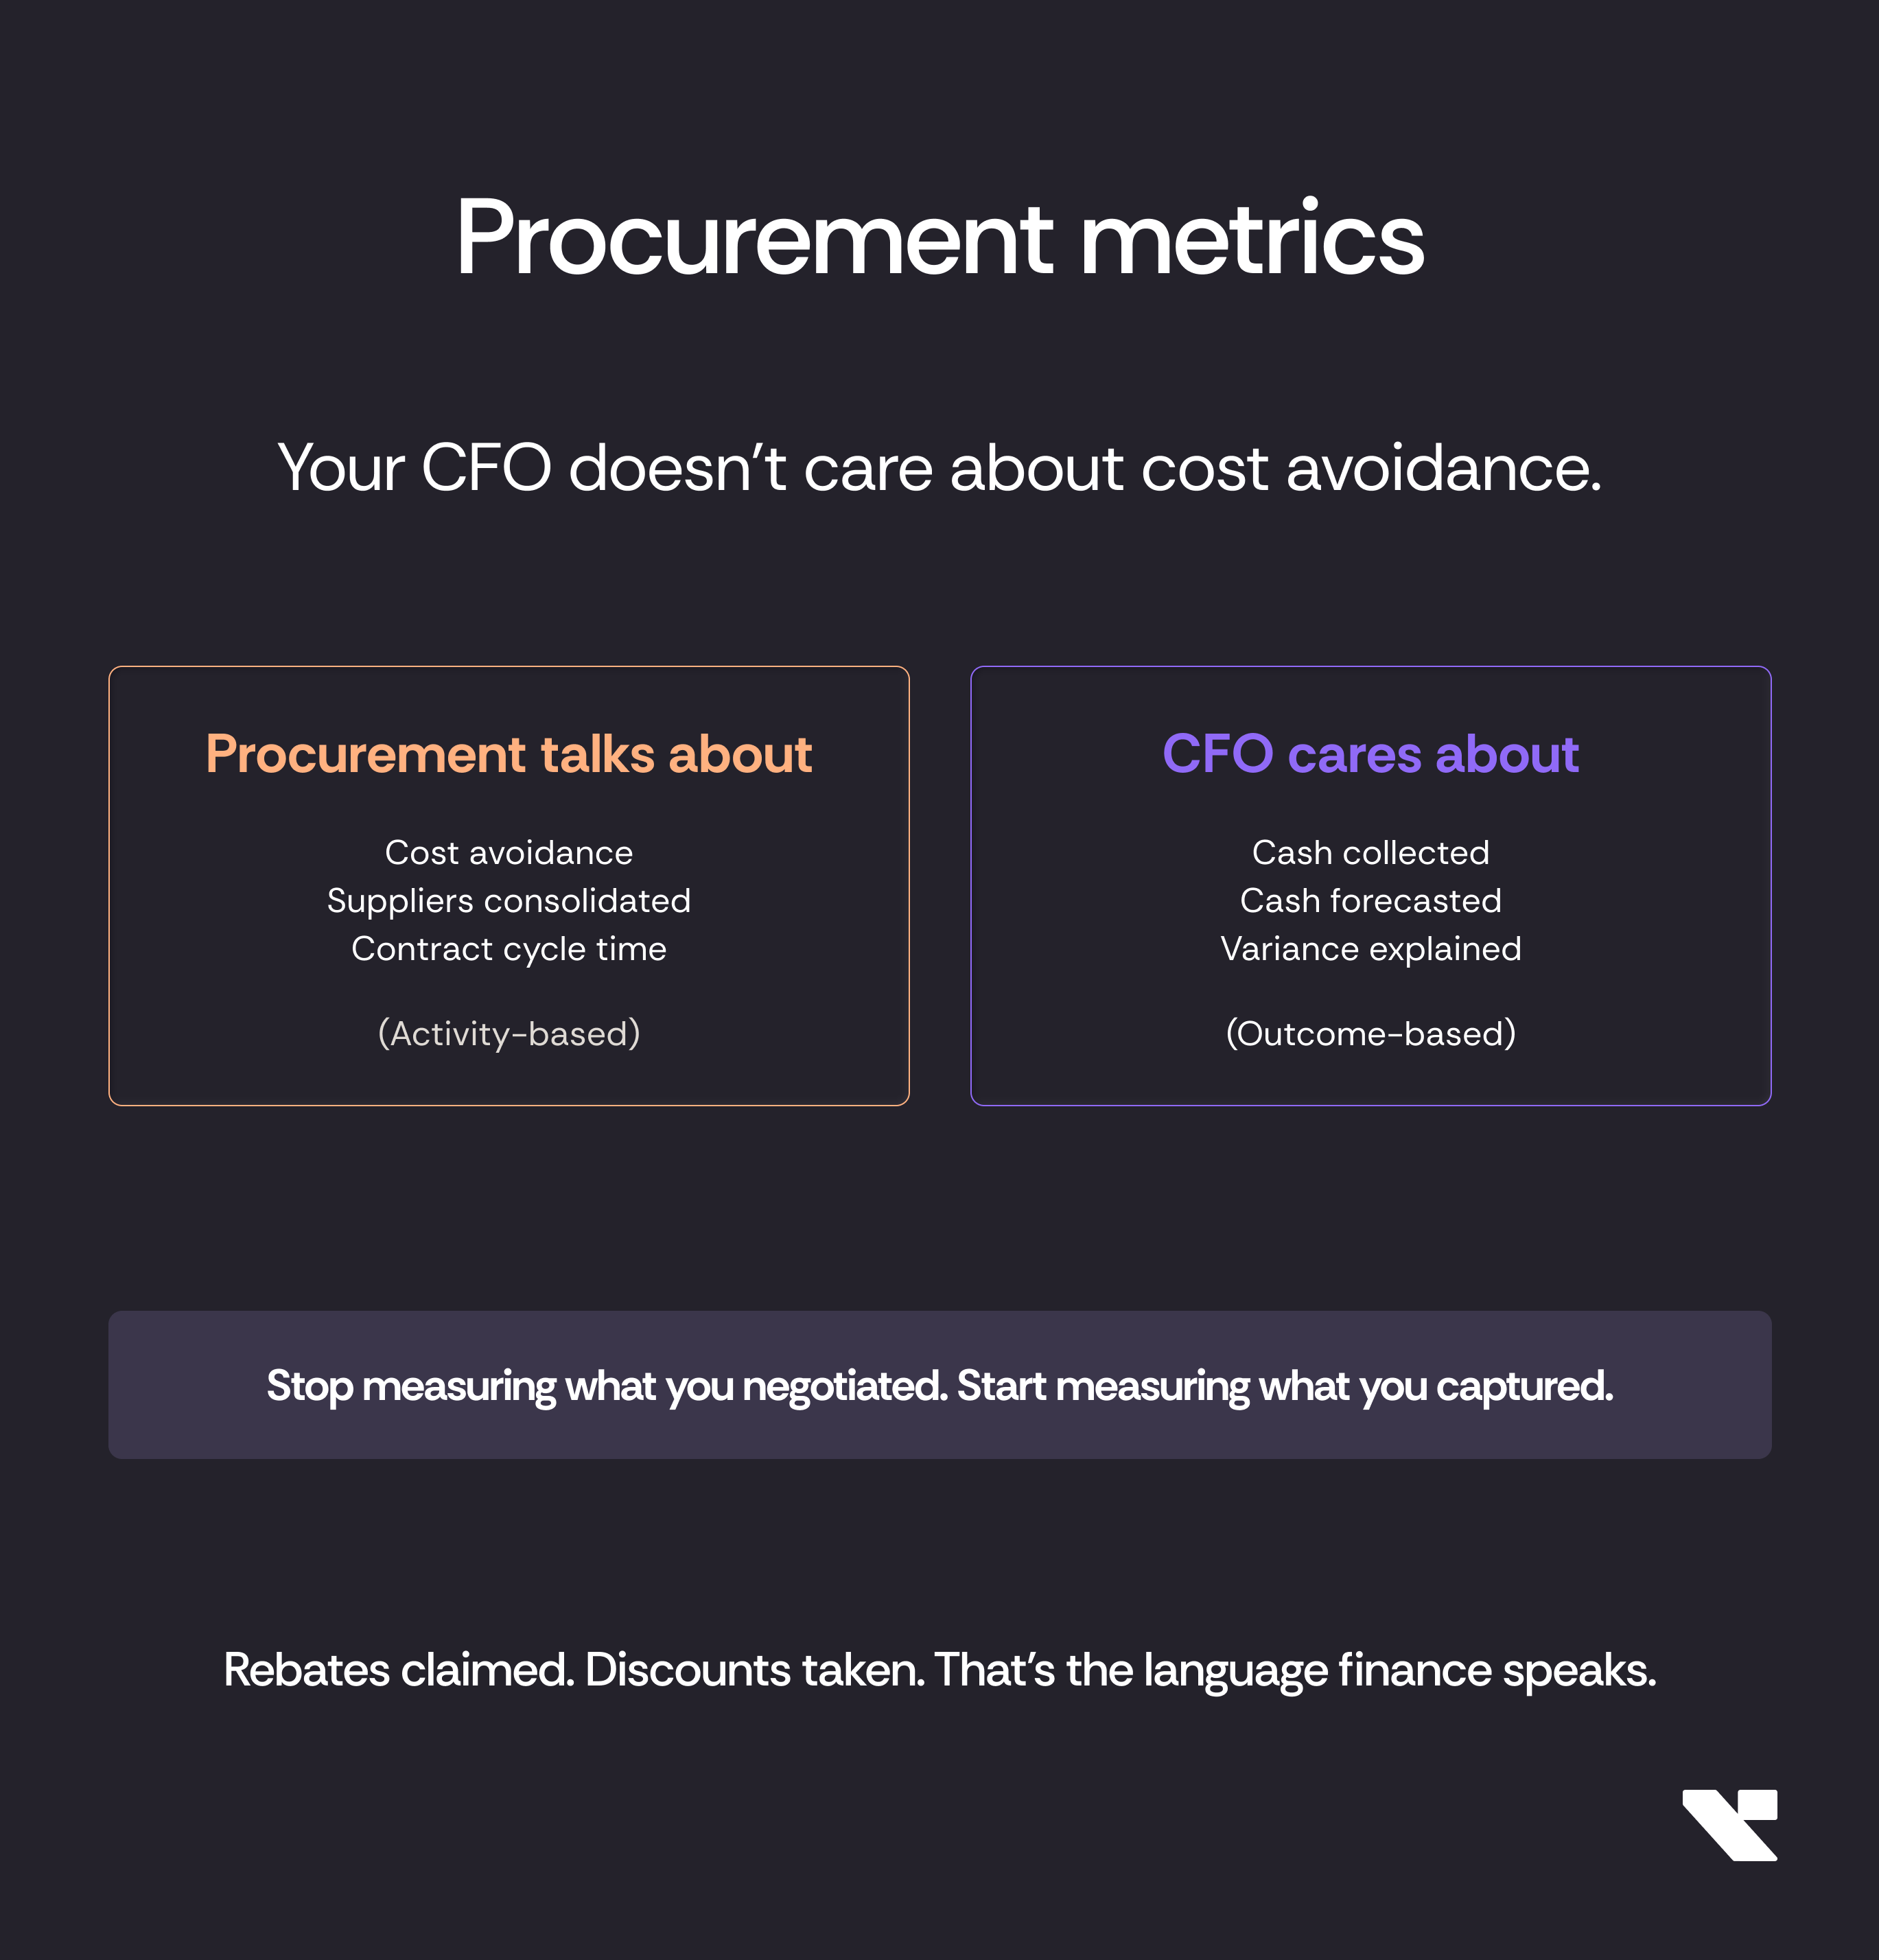
Your CFO cares about:
- Cash collected
- Cash forecasted
- Variance explained
Not savings. Not avoidance. Not theoretical value.
Cash. The language finance speaks.
Start speaking it.